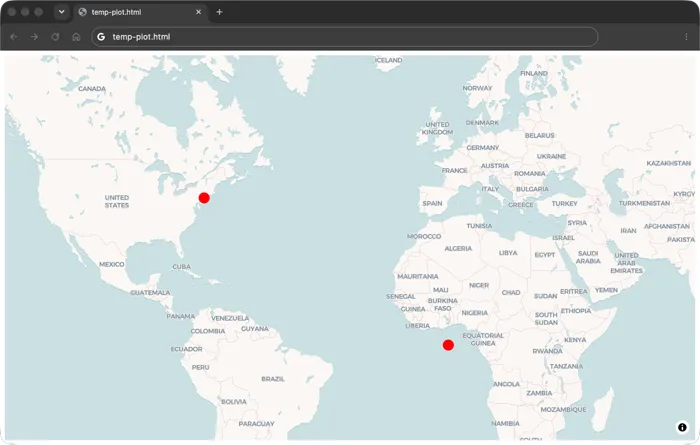
Plotting Markers on a Scattermap:
- Plotly Graph Objects has built-in functionality to display markers on a Scattermap.
- Example: we can specify a trace which is of type Scattermap on line 4. In other words, we are instantiating a Scattermap object.
- As the name implies, this Scattermap type of trace allows you to scatter markers on a geographical map.
- The points that you want to plot on this map will be indicated by its latitude and longitudinal coordinates.
- The lon/lat of 0, 0 refers to where Null Island is located.
- The lon/lat of -74, 40 is where New York City is located.
- The marker size on line 8 is equal to 20, and the color is set to red.
- The mode can be set to markers, lines, or text.
python
1import plotly.graph_objects as go
2import plotly.offline as offline
3
4trace = go.Scattermap(
5    lon = [0,-74],
6    lat = [0,40.7],
7    mode = "markers",
8    marker = dict(size = 20, color = "red"),
9    )
10
11layout = go.Layout(
12    map=dict(
13        style = "carto-voyager",
14        center = dict(lat = 39.5, lon = -98.35),
15        zoom = 3
16    ),
17    margin = {"r":0,"t":0,"l":0,"b":0})
18
19data = [trace]
20fig = dict(data = data, layout = layout)
21offline.plot(fig)- The go.Layout() class is used to define the layout of the map. It allows you to customize various aspects of the map, including the style, center, and zoom level.
- The style argument is set to carto-voyager, a free basemap style from CARTO. Other supported styles can be found in the Plotly documentation.
- The center argument defines the center of the map. In this case, the map is centered around the geographical center of the United States.
- The zoom argument controls the zoom level of the map. A higher zoom level means a closer view, while a lower zoom level means a wider view.
- Plotly uses the Web Mercator projection for mapping. which is a common projection used in web mapping applications.
- 0 = entire world
- 1–5 = continents/countries
- 6–10 = states/large regions
- 11–15 = cities/neighborhoods
- Plotly uses the Web Mercator projection for mapping. which is a common projection used in web mapping applications.
- The margin argument is used to set the margins around the map. In this case, all margins (right, top, left, bottom) are set to 0, which means there will be no extra space around the map.
Output: You can see where New York City is located in red. And if you pan out, you can see there’s another red marker where Null Island is located at lon/lat 0,0.